Our mission is to help computational modelers develop, document, and share their computational models in accordance with community standards and good open science and software engineering practices. Model authors can publish their model source code in the Computational Model Library with narrative documentation as well as metadata that supports open science and emerging norms that facilitate software citation, computational reproducibility / frictionless reuse, and interoperability. Model authors can also request private peer review of their computational models. Models that pass peer review receive a DOI once published.
All users of models published in the library must cite model authors when they use and benefit from their code.
Please check out our model publishing tutorial and feel free to contact us if you have any questions or concerns about publishing your model(s) in the Computational Model Library.
Displaying 10 of 1218 results for "Lee-Ann Sutherland" clear search
Social Construction of Reality Agent-Based Model
Manuel Castañón-Puga E. Dante Suarez Loren Demerath | Published Saturday, June 29, 2024This model illustrates the processes underlying the social construction of reality through an agent-based genetic algorithm. By simulating the interactions of agents within a structured environment, we have demonstrated how shared information and popularity contribute to the formation of emergent social structures with diverse cultures. The model illustrates how agents balance environmentally valid information with socially reliable information. It also highlights how social interaction leads to the formation of stable, yet diverse, social groups.
Location Analysis Hybrid ABM
Lukasz Kowalski | Published Friday, February 08, 2019The purpose of this hybrid ABM is to answer the question: where is the best place for a new swimming pool in a region of Krakow (in Poland)?
The model is well described in ODD protocol, that can be found in the end of my article published in JASSS journal (available online: http://jasss.soc.surrey.ac.uk/22/1/1.html ). Comparison of this kind of models with spatial interaction ones, is presented in the article. Before developing the model for different purposes, area of interest or services, I recommend reading ODD protocol and the article.
I published two films on YouTube that present the model: https://www.youtube.com/watch?v=iFWG2Xv20Ss , https://www.youtube.com/watch?v=tDTtcscyTdI&t=1s
…

Peer reviewed HUMLAND FIRE-IN-THE-HOLE agent-based model
Fulco Scherjon Anastasia Nikulina | Published Monday, October 20, 2025HUMLAND Fire-in-the-Hole is a conceptual agent-based model (ABM) designed to explore the ecological and behavioral consequences of fire-driven hunting strategies employed by hunter-gatherers, specifically Neanderthals, during the Last Interglacial period around the Neumark-Nord (Germany) archaeological site.
This model builds on and specializes the HUMLAND 1.0.0 model (Nikulina et al. 2024), integrating anthropogenic fires, elephant group behavior, and landscape response to simulate interactions between humans, megafauna, and vegetation over time.
TransportVarese
Elena Vallino Elena Maggi | Published Tuesday, January 31, 2017 | Last modified Friday, August 04, 2017This ABM deals with commuting choices in the Italian city of Varese. Empirical data inform agents’ attitudes and modal choices costs and emissions. We evaluate ex ante the impact of policies for less polluting commuting choices.
MERCURY extension: transport-cost
Tom Brughmans | Published Monday, July 23, 2018This is extended version of the MERCRUY model (Brughmans 2015) incorporates a ‘transport-cost’ variable, and is otherwise unchanged. This extended model is described in this publication: Brughmans, T., 2019. Evaluating the potential of computational modelling for informing debates on Roman economic integration, in: Verboven, K., Poblome, J. (Eds.), Structural Determinants in the Roman World.
Brughmans, T., 2015. MERCURY: an ABM of tableware trade in the Roman East. CoMSES Comput. Model Libr. URL https://www.comses.net/codebases/4347/releases/1.1.0/
Reflexivity in a diffusion of innovations model
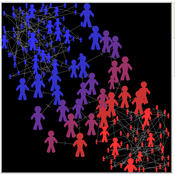
César García-Díaz Carlos Cordoba | Published Thursday, May 07, 2020In this agent-based model, agents decide to adopt a new product according to a utility function that depends on two kinds of social influences. First, there is a local influence exerted on an agent by her closest neighbors that have already adopted, and also by herself if she feels the product suits her personal needs. Second, there is a global influence which leads agents to adopt when they become aware of emerging trends happening in the system. For this, we endow agents with a reflexive capacity that allows them to recognize a trend, even if they can not perceive a significant change in their neighborhood.
Results reveal the appearance of slowdown periods along the adoption rate curve, in contrast with the classic stylized bell-shaped behavior. Results also show that network structure plays an important role in the effect of reflexivity: while some structures (e.g., scale-free networks) may amplify it, others (e.g., small-world structure) weaken such an effect.
Contract farming in the Mekong Delta's rice supply chain
Hung Nguyen | Published Tuesday, February 05, 2019We study three obstacles of the expansion of contract rice farming in the Mekong Delta (MKD) region. The failure of buyers in building trust-based relationship with small-holder farmers, unattractive offered prices from the contract farming scheme, and limited rice processing capacity have constrained contractors from participating in the large-scale paddy field program. We present an agent-based model to examine the viability of contract farming in the region from the contractor perspective.
The model focuses on financial incentives and trust, which affect the decision of relevant parties on whether to participate and honor a contract. The model is also designed in the context of the MKD’s rice supply chain with two contractors engaging in the contract rice farming scheme alongside an open market, in which both parties can renege on the agreement. We then evaluate the contractors’ performances with different combinations of scenarios related to the three obstacles.
Our results firstly show that a fully-equipped contractor who opportunistically exploits a relatively small proportion (less than 10%) of the contracted farmers in most instances can outperform spot market-based contractors in terms of average profit achieved for each crop. Secondly, a committed contractor who offers lower purchasing prices than the most typical rate can obtain better earnings per ton of rice as well as higher profit per crop. However, those contractors in both cases could not enlarge their contract farming scheme, since either farmers’ trust toward them decreases gradually or their offers are unable to compete with the benefits from a competitor or the spot market. Thirdly, the results are also in agreement with the existing literature that the contract farming scheme is not a cost-effective method for buyers with limited rice processing capacity, which is a common situation among the contractors in the MKD region.
FlowLogo for a real case study
Vahid Aghaie | Published Monday, May 18, 2020Juan Castilla-Rho et al. (2015) developed a platform, named FLowLogo, which integrates a 2D, finite-difference solution of the governing equations of groundwater flow with agent-based simulation. We used this model for Rafsanjan Aquifer, which is located in an arid region in Iran. To use FLowLogo for a real case study, one needs to add GIS shapefiles of boundary conditions and modify the code written in NetLogo a little bit. The FlowLogo model used in our research is presented here.
Learning-based Protection Motivation Theory Climate-Adaptive Behaviour model (LPMT-CAB)
Wenhan Feng | Published Thursday, April 09, 2026The aim of this model is to study the dynamic propagation of individual climate adaptive behaviours in different scenarios within the analytical framework of conservation motivation theory, focusing on the impact of social and experiential learning on the adoption of climate adaptive behaviours by coastal farmers.
Model for paper “Promoting climate resilience through learning-based behavioural change: Insights from an agent-based model of a coastal farming community in Guangxi, China” in Environmental Science & Policy, Volume 179, May 2026, 104375, https://doi.org/10.1016/j.envsci.2026.104375
Population Control
David Shanafelt | Published Monday, December 13, 2010 | Last modified Saturday, April 27, 2013This model looks at the effects of a “control” on agent populations. Much like farmers spraying pesticides/herbicides to manage pest populations, the user sets a control management regiment to be use
Displaying 10 of 1218 results for "Lee-Ann Sutherland" clear search