Our mission is to help computational modelers develop, document, and share their computational models in accordance with community standards and good open science and software engineering practices. Model authors can publish their model source code in the Computational Model Library with narrative documentation as well as metadata that supports open science and emerging norms that facilitate software citation, computational reproducibility / frictionless reuse, and interoperability. Model authors can also request private peer review of their computational models. Models that pass peer review receive a DOI once published.
All users of models published in the library must cite model authors when they use and benefit from their code.
Please check out our model publishing tutorial and feel free to contact us if you have any questions or concerns about publishing your model(s) in the Computational Model Library.
Displaying 10 of 98 results for "Evelyn Sperber" clear search
Emission Trading Impact On Power Generation Model
Emile Chappin | Published Friday, June 19, 2020Under the Kyoto Protocol, governments agreed on and accepted CO2 reduction targets in order to counter climate change. In Europe one of the main policy instruments to meet the agreed reduction targets is CO2 emission-trading (CET), which was implemented as of January 2005. In this system, companies active in specific sectors must be in the possession of CO2 emission rights to an amount equal to their CO2 emission. In Europe, electricity generation accounts for one-third of CO2 emissions. Since the power generation sector, has been liberalized, reregulated and privatized in the last decade, around Europe autonomous companies determine the sectors’ CO2 emission. Short-term they adjust their operation, long-term they decide on (dis)investment in power generation facilities and technology selection. An agent-based model is presented to elucidate the effect of CET on the decisions of power companies in an oligopolistic market. Simulations over an extensive scenario-space show that there CET does have an impact. A long-term portfolio shift towards less-CO2 intensive power generation is observed. However, the effect of CET is relatively small and materializes late. The absolute emissions from power generation rise under most scenarios. This corresponds to the dominant character of current capacity expansion planned in the Netherlands (50%) and in Germany (68%), where companies have announced many new coal based power plants. Coal is the most CO2 intensive option available and it seems surprising that even after the introduction of CET these capacity expansion plans indicate a preference for coal. Apparently in power generation the economic effect of CO2 emission-trading is not sufficient to outweigh the economic incentives to choose for coal.
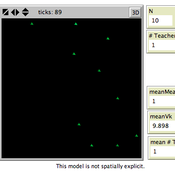
Effective population size and cultural evolution
Luke Premo | Published Tuesday, May 17, 2016This model illustrates how the effective population size and the rate of change in mean skill level of a cultural trait are affected by the presence of natural selection and/or the cultural transmission mechanism by which it is passed.
Evaluate government policies for farmers’ adoption and synergy in improving irrigation systems
Amir Hajimirzajan | Published Sunday, February 25, 2024The ABM model is designed to model the adaptability of farmers in DTIM. This model includes two groups of farmers and local government admins agents. Farmers with different levels, with low WP of DTIM, are looking for economic benefits and reduced irrigation and production costs. Meanwhile, the government is looking for strategic goals to maintain water resources’ sustainability. The local government admins employ incentives (subsidies in this study) to encourage farmers to DTIM. In addition, it is used as a tool for supervision and training farmers’ performance. Farmers are currently harvesting water resources with irrigation systems and different levels of technology, and they intend to provide short-term benefits. Farmers adjust the existing approach based on their knowledge of the importance of DTIM and propensity to increase WP and cost-benefit evaluation. DTIM has an initial implementation fee. Every farmer can increase WP by using government subsidies. If none of the farmers create optimal use of water resources, access to water resources will be threatened in the long term. This is considered a hypothetical cost for farmers who do not participate in DTIM. With DTIM, considering that local government admins’ facilities cover an essential part of implementation costs, farmers may think of profiting from local government admins’ facilities by selling that equipment, especially if the farmers in the following conditions may consider selling their developed irrigation equipment. In this case, the technology of their irrigation system will return to the state before development.
- When the threshold of farmers’ propensity to DTIM is low (for example, in the conditions of scarcity of access to sufficient training about the new irrigation system or its role in reducing the cost and sustainability of water resources)
- When the share of government subsidy is high, and as a result, the profit from the sale of equipment is attractive, especially in conditions of inflation.
- Finally, farmers’ honesty threshold should be reduced based on the positive experience of profit-seeking and deception among neighbors.
Increasing the share of government subsidies can encourage farmers to earn profits. Therefore, the government can help increase farmers’ profits by considering the assessment teams at different levels with DTIM training . local government admins evaluations monitor the behavior of farmers. If farmers sell their improved irrigation system for profit, they may be deprived of some local government admins’ services and the possibility of receiving subsidies again. Assessments The local government admins can increase farmers’ honesty. Next, the ABM model evaluates local government admins policies to achieve a suitable framework for water resources management in the Miandoab region.
Ant Colony Optimization for infrastructure routing
Igor Nikolic Emile Chappin P W Heijnen | Published Wednesday, March 05, 2014 | Last modified Saturday, March 24, 2018The mode implements a variant of Ant Colony Optimization to explore routing on infrastructures through a landscape with forbidden zones, connecting multiple sinks to one source.
The various technologies used inside a Dutch greenhouse interact in combination with an external climate, resulting in an emergent internal climate, which contributes to the final productivity of the greenhouse. This model examines how differing technology development styles affects the overall ability of a community of growers to approach the theoretical maximum yield.
The Targeted Subsidies Plan Model
Hassan Bashiri | Published Thursday, September 21, 2023The targeted subsidies plan model is based on the economic concept of targeted subsidies.
The targeted subsidies plan model simulates the distribution of subsidies among households in a community over several years. The model assumes that the government allocates a fixed amount of money each year for the purpose of distributing cash subsidies to eligible households. The eligible households are identified by dividing families into 10 groups based on their income, property, and wealth. The subsidy is distributed to the first four groups, with the first group receiving the highest subsidy amount. The model simulates the impact of the subsidy distribution process on the income and property of households in the community over time.
The model simulates a community of 230 households, each with a household income and wealth that follows a power-law distribution. The number of household members is modeled by a normal distribution. The model allocates a fixed amount of money each year for the purpose of distributing cash subsidies among eligible households. The eligible households are identified by dividing families into 10 groups based on their income, property, and wealth. The subsidy is distributed to the first four groups, with the first group receiving the highest subsidy amount.
The model runs for a period of 10 years, with the subsidy distribution process occurring every month. The subsidy received by each household is assumed to be spent, and a small portion may be saved and added to the household’s property. At the end of each year, the grouping of households based on income and assets is redone, and a number of families may be moved from one group to another based on changes in their income and property.
…
Agent-Based Model of a Circular Food Packaging Ecosystem to assess Packaging Waste Dynamics
Annoek Reitsema | Published Friday, October 11, 2024Reducing packaging waste is a critical challenge that requires organizations to collaborate within circular ecosystems, considering social, economic, and technical variables like decision-making behavior, material prices, and available technologies. Agent-Based Modeling (ABM) offers a valuable methodology for understanding these complex dynamics. In our research, we have developed an ABM to explore circular ecosystems’ potential in reducing packaging waste, using a case study of the Dutch food packaging ecosystem. The model incorporates three types of agents—beverage producers, packaging producers, and waste treaters—who can form closed-loop recycling systems.
Beverage Producer Agents: These agents represent the beverage company divided into five types based on packaging formats: cans, PET bottles, glass bottles, cartons, and bag-in-boxes. Each producer has specific packaging demands based on product volume, type, weight, and reuse potential. They select packaging suppliers annually, guided by deterministic decision styles: bargaining (seeking the lowest price) or problem-solving (prioritizing high recycled content).
Packaging Producer Agents: These agents are responsible for creating packaging using either recycled or virgin materials. The model assumes a mix of monopolistic and competitive market situations, with agents calculating annual material needs. Decision styles influence their choices: bargaining agents compare recycled and virgin material costs, while problem-solving agents prioritize maximum recycled content. They calculate recycled content in packaging and set prices accordingly, ensuring all produced packaging is sold within or outside the model.
…
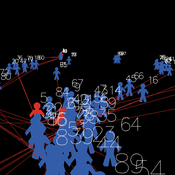
Peer reviewed Organizational behavior in the hierarchy model
Smarzhevskiy Ivan | Published Tuesday, June 18, 2019 | Last modified Wednesday, July 31, 2019In a two-level hierarchical structure (consisting of the positions of managers and operators), persons holding these positions have a certain performance and the value of their own (personal perception in this, simplified, version of the model) perception of each other. The value of the perception of each other by agents is defined as a random variable that has a normal distribution (distribution parameters are set by the control elements of the interface).
In the world of the model, which is the space of perceptions, agents implement two strategies: rapprochement with agents that perceive positively and distance from agents that perceive negatively (both can be implemented, one of these strategies, or neither, the other strategy, which makes the agent stationary). Strategies are implemented in relation to those agents that are in the radius of perception (PerRadius).
The manager (Head) forms a team of agents. The performance of the group (the sum of the individual productivities of subordinates, weighted by the distance from the leader) varies depending on the position of the agents in space and the values of their individual productivities. Individual productivities, in the current version of the model, are set as a random variable distributed evenly on a numerical segment from 0 to 100. The manager forms the team 1) from agents that are in (organizational) radius (Op_Radius), 2) among agents that the manager perceives positively and / or negatively (both can be implemented, one of the specified rules, or neither, which means the refusal of the command formation).
Agents can (with a certain probability, given by the variable PrbltyOfDecisn%), in case of a negative perception of the manager, leave his group permanently.
It is possible in the model to change on the fly radii values, update the perception value across the entire population and the perception of an individual agent by its neighbors within the perception radius, and the probability values for a subordinate to make a decision about leaving the group.
You can also change the set of strategies for moving agents and strategies for recruiting a team manager. It is possible to add a randomness factor to the movement of agents (Stoch_Motion_Speed, the default is set to 0, that is, there are no random movements).
…
Income and Expenditure
Tony Lawson | Published Thursday, October 06, 2011 | Last modified Saturday, April 27, 2013How do households alter their spending patterns when they experience changes in income? This model answers this question using a random assignment scheme where spending patterns are copied from a household in the new income bracket.
WeDiG Sim
Reza Shamsaee | Published Monday, May 14, 2012 | Last modified Saturday, April 27, 2013WeDiG Sim- Weighted Directed Graph Simulator - is an open source application that serves to simulate complex systems. WeDiG Sim reflects the behaviors of those complex systems that put stress on scale-free, weightedness, and directedness. It has been implemented based on “WeDiG model” that is newly presented in this domain. The WeDiG model can be seen as a generalized version of “Barabási-Albert (BA) model”. WeDiG not only deals with weighed directed systems, but also it can handle the […]
Displaying 10 of 98 results for "Evelyn Sperber" clear search