Our mission is to help computational modelers develop, document, and share their computational models in accordance with community standards and good open science and software engineering practices. Model authors can publish their model source code in the Computational Model Library with narrative documentation as well as metadata that supports open science and emerging norms that facilitate software citation, computational reproducibility / frictionless reuse, and interoperability. Model authors can also request private peer review of their computational models. Models that pass peer review receive a DOI once published.
All users of models published in the library must cite model authors when they use and benefit from their code.
Please check out our model publishing tutorial and feel free to contact us if you have any questions or concerns about publishing your model(s) in the Computational Model Library.
Displaying 10 of 826 results for "Jon Solera" clear search
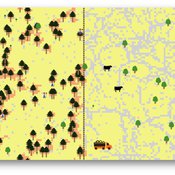
TRUE GRASP (Tree Recruitment Under Exotic GRAsses in a Savanna-Pineland)
is a socio-ecological agent-based model (ABM) and role playing game (RPG) for farmers and other stakeholders involved in rural landscape planning.
The purpose of this model is to allow actors to explore the individual and combined effects - as well as tradeoffs - of three methods of controlling exotic grasses in pine savannas: fire, weeding, and grazing cattle.
Design of TRUE GRASP is based on 3 years of socio-ecological fieldwork in a human-induced pine savanna in La Sepultura Biosphere Reserve (SBR) in the Mexican state of Chiapas. In this savanna, farmers harvest resin from Pinus oocarpa, which is used to produce turpentine and other products. However, long term persistence of this activity is jeopardized by low tree recruitment due to exotic tall grass cover in the forest understory (see Braasch et al., 2017). The TRUE GRASP model provides the user with different management strategies for controlling exotic grass cover and avoiding possible regime shifts, which in the case of the SBR would jeopardize resin harvesting.
Peer reviewed FishMob: Interactions between fisher mobility and spatial resource heterogeneity
Emilie Lindkvist | Published Wednesday, October 16, 2019 | Last modified Tuesday, June 23, 2020Migration or other long-distance movement into other regions is a common strategy of fishers and fishworkers living and working on the coast to adapt to environmental change. This model attempts to understand the general dynamics of fisher mobility for over larger spatial scales. The model can be used for investigating the complex interplay that exists between mobility and fish stock heterogeneity across regions, and the associated outcomes of mobility at the system level.
The model design informed by the example of small-scale fisheries in the Gulf of California, Mexico but implements theoretical and stylized facts and can as such be used for different archetypical cases. Our methodological approach for designing the model aims to account for the complex causation, emergence and interdependencies in small-scale fisheries to explain the phenomenon of sequential overexploitation, i.e., overexploiting one resource after another. The model is intended to be used as a virtual laboratory to investigate when and how different levels of mobile fishers affect exploitation patterns of fisheries resources.
SiFlo: An Agent-based Model to simulate inhabitants’ behavior during a flood event
Patrick Taillandier Franck Taillandier Pascal Di Maiolo Rasool Mehdizadeh | Published Thursday, July 29, 2021SiFlo is an ABM dedicated to simulate flood events in urban areas. It considers the water flowing and the reaction of the inhabitants. The inhabitants would be able to perform different actions regarding the flood: protection (protect their house, their equipment and furniture…), evacuation (considering traffic model), get and give information (considering imperfect knowledge), etc. A special care was taken to model the inhabitant behavior: the inhabitants should be able to build complex reasoning, to have emotions, to follow or not instructions, to have incomplete knowledge about the flood, to interfere with other inhabitants, to find their way on the road network. The model integrates the closure of roads and the danger a flooded road can represent. Furthermore, it considers the state of the infrastructures and notably protection infrastructures as dyke. Then, it allows to simulate a dyke breaking.
The model intends to be generic and flexible whereas provide a fine geographic description of the case study. In this perspective, the model is able to directly import GIS data to reproduce any territory. The following sections expose the main elements of the model.
User Guide and Templates for RAT-RS (a reporting standard for improving the documentation of data use in agent-based modelling)
Melania Borit Edmund Chattoe-Brown Peer-Olaf Siebers Sebastian Achter | Published Saturday, March 12, 2022The Rigor and Transparency Reporting Standard (RAT-RS) is a tool to improve the documentation of data use in Agent-Based Modelling. Following the development of reporting standards for models themselves, attention to empirical models has now reached a stage where these standards need to take equally effective account of data use (which until now has tended to be an afterthought to model description). It is particularly important that a standard should allow the reporting of the different uses to which data may be put (specification, calibration and validation), but also that it should be compatible with the integration of different kinds of data (for example statistical, qualitative, ethnographic and experimental) sometimes known as mixed methods research.
For the full details on the RAT-RS, please refer to the related publication “RAT-RS: A Reporting Standard for Improving the Documentation of Data Use in Agent-Based Modelling” (http://dx.doi.org/10.1080/13645579.2022.2049511).
Here we provide supplementary material for this article, consisting of a RAT-RS user guide and RAT-RS templates.
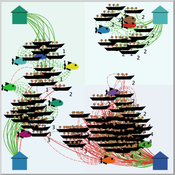
RBM - A Relation-based model - a fishery implementation
Nanda Wijermans Maja Schlüter Anja Klein Tilman Hertz | Published Monday, March 17, 2025The Relation-Based Model (RBM) purpose is to operationalise (a form of) process-relational (PR) thinking to serve as a thinking tool for process-relational thinking among social-ecological system (SES) researchers. The development of this model itself has been a ‘Proof of concept’- exercise to see whether we actually represent process-relational thinking in a methodology that is entity-based (ABM).
The target of the agent-based model is to show the emergence, change and disappearance of fishing assemblages (focusing on processes of self-organisation) in a Mexican fishery using a process-relational view. From this view, a fishery is regarded as an assemblage in which fishing can be enabled, fishing can occur, and fish can be bought/sold. These core doings - or sub-assemblages or capacities - maintain the assemblage. Each (sub)assemblage reflects different actualisations of constellations of relations and elements (buyers, fishers, fuel, permits, vessels and wind). The RBM thereby reflects an artificial fishery in which agents (elements) and their links (relations) engage in (enabling) fishing and buying/selling.
Using Agent-Based Modelling and Reinforcement Learning to Study Hybrid Threats
kpadur | Published Friday, September 20, 2024Hybrid attacks coordinate the exploitation of vulnerabilities across domains to undermine trust in authorities and cause social unrest. Whilst such attacks have primarily been seen in active conflict zones, there is growing concern about the potential harm that can be caused by hybrid attacks more generally and a desire to discover how better to identify and react to them. In addressing such threats, it is important to be able to identify and understand an adversary’s behaviour. Game theory is the approach predominantly used in security and defence literature for this purpose. However, the underlying rationality assumption, the equilibrium concept of game theory, as well as the need to make simplifying assumptions can limit its use in the study of emerging threats. To study hybrid threats, we present a novel agent-based model in which, for the first time, agents use reinforcement learning to inform their decisions. This model allows us to investigate the behavioural strategies of threat agents with hybrid attack capabilities as well as their broader impact on the behaviours and opinions of other agents.
Replica of Turchin's (2003) Metaethnic Frontier model
Paul Smaldino | Published Sunday, February 15, 2026In his 2003 book, Historical Dynamics (ch. 4), Turchin describes and briefly analyzes a spatial ABM of his metaethnic frontier theory, which is essentially a formalization of a theory by Ibn Khaldun in the 14th century. In the model, polities compete with neighboring polities and can absorb them into an empire. Groups possess “asabiya”, a measure of social solidarity and a sense of shared purpose. Regions that share borders with other groups will have increased asabiya do to salient us vs. them competition. High asabiya enhances the ability to grow, work together, and hence wage war on neighboring groups and assimilate them into an empire. The larger the frontier, the higher the empire’s asabiya.
As an empire expands, (1) increased access to resources drives further growth; (2) internal conflict decreases asabiya among those who live far from the frontier; and (3) expanded size of the frontier decreases ability to wage war along all frontiers. When an empire’s asabiya decreases too much, it collapses. Another group with more compelling asabiya eventually helps establish a new empire.
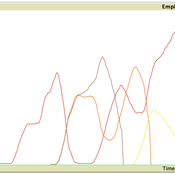
Peer reviewed Neighbor Influenced Energy Retrofit (NIER) agent-based model
Eric Boria | Published Friday, April 03, 2020The NIER model is intended to add qualitative variables of building owner types and peer group scales to existing energy efficiency retrofit adoption models. The model was developed through a combined methodology with qualitative research, which included interviews with key stakeholders in Cleveland, Ohio and Detroit and Grand Rapids, Michigan. The concepts that the NIER model adds to traditional economic feasibility studies of energy retrofit decision-making are differences in building owner types (reflecting strategies for managing buildings) and peer group scale (neighborhoods of various sizes and large-scale Districts). Insights from the NIER model include: large peer group comparisons can quickly raise the average energy efficiency values of Leader and Conformist building owner types, but leave Stigma-avoider owner types as unmotivated to retrofit; policy interventions such as upgrading buildings to energy-related codes at the point of sale can motivate retrofits among the lowest efficient buildings, which are predominantly represented by the Stigma-avoider type of owner; small neighborhood peer groups can successfully amplify normal retrofit incentives.
WeDiG Sim
Reza Shamsaee | Published Monday, May 14, 2012 | Last modified Saturday, April 27, 2013WeDiG Sim- Weighted Directed Graph Simulator - is an open source application that serves to simulate complex systems. WeDiG Sim reflects the behaviors of those complex systems that put stress on scale-free, weightedness, and directedness. It has been implemented based on “WeDiG model” that is newly presented in this domain. The WeDiG model can be seen as a generalized version of “Barabási-Albert (BA) model”. WeDiG not only deals with weighed directed systems, but also it can handle the […]
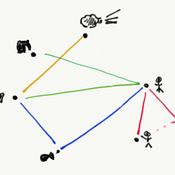
Rebel Group Protection Rackets
Gerd Wagner Luis Gustavo Nardin Kamil C. Klosek Frances Duffy | Published Wednesday, December 04, 2019System Narrative
How do rebel groups control territory and engage with the local economy during civil war? Charles Tilly’s seminal War and State Making as Organized Crime (1985) posits that the process of waging war and providing governance resembles that of a protection racket, in which aspiring governing groups will extort local populations in order to gain power, and civilians or businesses will pay in order to ensure their own protection. As civil war research increasingly probes the mechanisms that fuel local disputes and the origination of violence, we develop an agent-based simulation model to explore the economic relationship of rebel groups with local populations, using extortion racket interactions to explain the dynamics of rebel fighting, their impact on the economy, and the importance of their economic base of support. This analysis provides insights for understanding the causes and byproducts of rebel competition in present-day conflicts, such as the cases of South Sudan, Afghanistan, and Somalia.
Model Description
The model defines two object types: RebelGroup and Enterprise. A RebelGroup is a group that competes for power in a system of anarchy, in which there is effectively no government control. An Enterprise is a local civilian-level actor that conducts business in this environment, whose objective is to make a profit. In this system, a RebelGroup may choose to extort money from Enterprises in order to support its fighting efforts. It can extract payments from an Enterprise, which fears for its safety if it does not pay. This adds some amount of money to the RebelGroup’s resources, and they can return to extort the same Enterprise again. The RebelGroup can also choose to loot the Enterprise instead. This results in gaining all of the Enterprise wealth, but prompts the individual Enterprise to flee, or leave the model. This reduces the available pool of Enterprises available to the RebelGroup for extortion. Following these interactions the RebelGroup can choose to AllocateWealth, or pay its rebel fighters. Depending on the value of its available resources, it can add more rebels or expel some of those which it already has, changing its size. It can also choose to expand over new territory, or effectively increase its number of potential extorting Enterprises. As a response to these dynamics, an Enterprise can choose to Report expansion to another RebelGroup, which results in fighting between the two groups. This system shows how, faced with economic choices, RebelGroups and Enterprises make decisions in war that impact conflict and violence outcomes.
Displaying 10 of 826 results for "Jon Solera" clear search