Our mission is to help computational modelers develop, document, and share their computational models in accordance with community standards and good open science and software engineering practices. Model authors can publish their model source code in the Computational Model Library with narrative documentation as well as metadata that supports open science and emerging norms that facilitate software citation, computational reproducibility / frictionless reuse, and interoperability. Model authors can also request private peer review of their computational models. Models that pass peer review receive a DOI once published.
All users of models published in the library must cite model authors when they use and benefit from their code.
Please check out our model publishing tutorial and feel free to contact us if you have any questions or concerns about publishing your model(s) in the Computational Model Library.
Displaying 10 of 556 results for "Niklas Hase" clear search
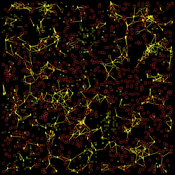
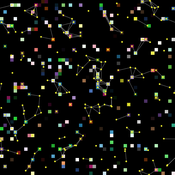
Cellular automata model of social networks
Rubens de Almeida Zimbres | Published Tuesday, August 02, 2022This project was developed during the Santa Fe course Introduction to Agent-Based Modeling 2022. The origin is a Cellular Automata (CA) model to simulate human interactions that happen in the real world, from Rubens and Oliveira (2009). These authors used a market research with real people in two different times: one at time zero and the second at time zero plus 4 months (longitudinal market research). They developed an agent-based model whose initial condition was inherited from the results of the first market research response values and evolve it to simulate human interactions with Agent-Based Modeling that led to the values of the second market research, without explicitly imposing rules. Then, compared results of the model with the second market research. The model reached 73.80% accuracy.
In the same way, this project is an Exploratory ABM project that models individuals in a closed society whose behavior depends upon the result of interaction with two neighbors within a radius of interaction, one on the relative “right” and other one on the relative “left”. According to the states (colors) of neighbors, a given cellular automata rule is applied, according to the value set in Chooser. Five states were used here and are defined as levels of quality perception, where red (states 0 and 1) means unhappy, state 3 is neutral and green (states 3 and 4) means happy.
There is also a message passing algorithm in the social network, to analyze the flow and spread of information among nodes. Both the cellular automaton and the message passing algorithms were developed using the Python extension. The model also uses extensions csv and arduino.
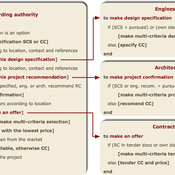
Enhancing recycling of construction materials; an agent based model with empirically based decision parameters
Igor Nikolic Claudia Binder Christof Knoeri Hans-Joerg Althaus | Published Sunday, October 21, 2012 | Last modified Monday, June 09, 2014This model allows for analyzing the most efficient levers for enhancing the use of recycled construction materials, and the role of empirically based decision parameters.
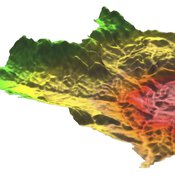
MedLanD Modeling Laboratory
C Michael Barton Sean Bergin Isaac Ullah Gary Mayer Hessam Sarjoughian Helena Mitasova | Published Friday, May 08, 2015 | Last modified Thursday, December 14, 2017The MML is a hybrid modeling environment that couples an agent-based model of small-holder agropastoral households and a cellular landscape evolution model that simulates changes in erosion/deposition, soils, and vegetation.
The Internal Organizational Plasticity Model (IOP 2.1.2)
Davide Secchi | Published Tuesday, June 02, 2020IOP 2.1.2 is an agent-based simulation model designed to explore the relations between (1) employees, (2) tasks and (3) resources in an organizational setting. By comparing alternative cognitive strategies in the use of resources, employees face increasingly demanding waves of tasks that derive by challenges the organization face to adapt to a turbulent environment. The assumption tested by this model is that a successful organizational adaptation, called plastic, is necessarily tied to how employees handle pressure coming from existing and new tasks. By comparing alternative cognitive strategies, connected to ‘docility’ (Simon, 1993; Secchi, 2011) and ‘extended’ cognition (Clark, 2003, Secchi & Cowley, 2018), IOP 2.1.2 is an attempt to indicate which strategy is most suitable and under which scenario.
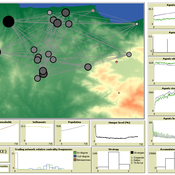
AncientS-ABM: Agent-Based Modeling of Past Societies Social Organization
Angelos Chliaoutakis | Published Thursday, April 09, 2020AncientS-ABM is an agent-based model for simulating and evaluating the potential social organization of an artificial past society, configured by available archaeological data. Unlike most existing agent-based models used in archaeology, our ABM framework includes completely autonomous, utility-based agents. It also incorporates different social organization paradigms, different decision-making processes, and also different cultivation technologies used in ancient societies. Equipped with such paradigms, the model allows us to explore the transition from a simple to a more complex society by focusing on the historical social dynamics; and to assess the influence of social organization on agents’ population growth, agent community numbers, sizes and distribution.
AncientS-ABM also blends ideas from evolutionary game theory with multi-agent systems’ self-organization. We model the evolution of social behaviours in a population of strategically interacting agents in repeated games where they exchange resources (utility) with others. The results of the games contribute to both the continuous re-organization of the social structure, and the progressive adoption of the most successful agent strategies. Agent population is not fixed, but fluctuates over time, while agents in stage games also receive non-static payoffs, in contrast to most games studied in the literature. To tackle this, we defined a novel formulation of the evolutionary dynamics via assessing agents’ rather than strategies’ fitness.
As a case study, we employ AncientS-ABM to evaluate the impact of the implemented social organization paradigms on an artificial Bronze Age “Minoan” society, located at different geographical parts of the island of Crete, Greece. Model parameter choices are based on archaeological evidence and studies, but are not biased towards any specific assumption. Results over a number of different simulation scenarios demonstrate better sustainability for settlements consisting of and adopting a socio-economic organization model based on self-organization, where a “heterarchical” social structure emerges. Results also demonstrate that successful agent societies adopt an evolutionary approach where cooperation is an emergent strategic behaviour. In simulation scenarios where the natural disaster module was enabled, we observe noticeable changes in the settlements’ distribution, relating to significantly higher migration rates immediately after the modeled Theran eruption. In addition, the initially cooperative behaviour is transformed to a non-cooperative one, thus providing support for archaeological theories suggesting that the volcanic eruption led to a clear breakdown of the Minoan socio-economic system.
…
The Targeted Subsidies Plan Model
Hassan Bashiri | Published Thursday, September 21, 2023The targeted subsidies plan model is based on the economic concept of targeted subsidies.
The targeted subsidies plan model simulates the distribution of subsidies among households in a community over several years. The model assumes that the government allocates a fixed amount of money each year for the purpose of distributing cash subsidies to eligible households. The eligible households are identified by dividing families into 10 groups based on their income, property, and wealth. The subsidy is distributed to the first four groups, with the first group receiving the highest subsidy amount. The model simulates the impact of the subsidy distribution process on the income and property of households in the community over time.
The model simulates a community of 230 households, each with a household income and wealth that follows a power-law distribution. The number of household members is modeled by a normal distribution. The model allocates a fixed amount of money each year for the purpose of distributing cash subsidies among eligible households. The eligible households are identified by dividing families into 10 groups based on their income, property, and wealth. The subsidy is distributed to the first four groups, with the first group receiving the highest subsidy amount.
The model runs for a period of 10 years, with the subsidy distribution process occurring every month. The subsidy received by each household is assumed to be spent, and a small portion may be saved and added to the household’s property. At the end of each year, the grouping of households based on income and assets is redone, and a number of families may be moved from one group to another based on changes in their income and property.
…
The uFUNK Model
Davide Secchi | Published Monday, August 31, 2020The agent-based simulation is set to work on information that is either (a) functional, (b) pseudo-functional, (c) dysfunctional, or (d) irrelevant. The idea is that a judgment on whether information falls into one of the four categories is based on the agent and its network. In other words, it is the agents who interprets a particular information as being (a), (b), (c), or (d). It is a decision based on an exchange with co-workers. This makes the judgment a socially-grounded cognitive exercise. The uFUNK 1.0.2 Model is set on an organization where agent-employee work on agent-tasks.
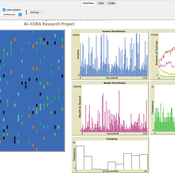
Peer reviewed The Indus Village's Weather model: procedural generation of daily weather
Andreas Angourakis | Published Tuesday, May 13, 2025Overview
The Weather model is a procedural generation model designed to create realistic daily weather data for socioecological simulations. It generates synthetic weather time series for solar radiation, temperature, and precipitation using algorithms based on sinusoidal and double logistic functions. The model incorporates stochastic variation to mimic unpredictable weather patterns and aims to provide realistic yet flexible weather inputs for exploring diverse climate scenarios.
The Weather model can be used independently or integrated into larger models, providing realistic weather patterns without extensive coding or data collection. It can be customized to meet specific requirements, enabling users to gain a better understanding of the underlying mechanisms and have greater confidence in their applications.
…
RecovUS: An Agent-Based Model of Post-Disaster Household Recovery
Saeed Moradi | Published Thursday, July 30, 2020The purpose of this model is to explain the post-disaster recovery of households residing in their own single-family homes and to predict households’ recovery decisions from drivers of recovery. Herein, a household’s recovery decision is repair/reconstruction of its damaged house to the pre-disaster condition, waiting without repair/reconstruction, or selling the house (and relocating). Recovery drivers include financial conditions and functionality of the community that is most important to a household. Financial conditions are evaluated by two categories of variables: costs and resources. Costs include repair/reconstruction costs and rent of another property when the primary house is uninhabitable. Resources comprise the money required to cover the costs of repair/reconstruction and to pay the rent (if required). The repair/reconstruction resources include settlement from the National Flood Insurance (NFI), Housing Assistance provided by the Federal Emergency Management Agency (FEMA-HA), disaster loan offered by the Small Business Administration (SBA loan), a share of household liquid assets, and Community Development Block Grant Disaster Recovery (CDBG-DR) fund provided by the Department of Housing and Urban Development (HUD). Further, household income determines the amount of rent that it can afford. Community conditions are assessed for each household based on the restoration of specific anchors. ASNA indexes (Nejat, Moradi, & Ghosh 2019) are used to identify the category of community anchors that is important to a recovery decision of each household. Accordingly, households are indexed into three classes for each of which recovery of infrastructure, neighbors, or community assets matters most. Further, among similar anchors, those anchors are important to a household that are located in its perceived neighborhood area (Moradi, Nejat, Hu, & Ghosh 2020).
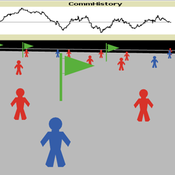
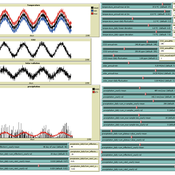
Model of communication between two groups of managers in the course of project implementation
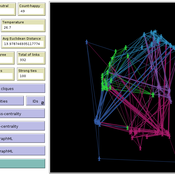
Smarzhevskiy Ivan | Published Monday, December 07, 2020This is a simulation model of communication between two groups of managers in the course of project implementation. The “world” of the model is a space of interaction between project participants, each of which belongs either to a group of work performers or to a group of customers. Information about the progress of the project is publicly available and represents the deviation Earned value (EV) from the planned project value (cost baseline).
The key elements of the model are 1) persons belonging to a group of customers or performers, 2) agents that are communication acts. The life cycle of persons is equal to the time of the simulation experiment, the life cycle of the communication act is 3 periods of model time (for the convenience of visualizing behavior during the experiment). The communication act occurs at a specific point in the model space, the coordinates of which are realized as random variables. During the experiment, persons randomly move in the model space. The communication act involves persons belonging to a group of customers and a group of performers, remote from the place of the communication act at a distance not exceeding the value of the communication radius (MaxCommRadius), while at least one representative from each of the groups must participate in the communication act. If none are found, the communication act is not carried out. The number of potential communication acts per unit of model time is a parameter of the model (CommPerTick).
The managerial sense of the feedback is the stimulating effect of the positive value of the accumulated communication complexity (positive background of the project implementation) on the productivity of the performers. Provided there is favorable communication (“trust”, “mutual understanding”) between the customer and the contractor, it is more likely that project operations will be performed with less lag behind the plan or ahead of it.
The behavior of agents in the world of the model (change of coordinates, visualization of agents’ belonging to a specific communicative act at a given time, etc.) is not informative. Content data are obtained in the form of time series of accumulated communicative complexity, the deviation of the earned value from the planned value, average indicators characterizing communication - the total number of communicative acts and the average number of their participants, etc. These data are displayed on graphs during the simulation experiment.
The control elements of the model allow seven independent values to be varied, which, even with a minimum number of varied values (three: minimum, maximum, optimum), gives 3^7 = 2187 different variants of initial conditions. In this case, the statistical processing of the results requires repeated calculation of the model indicators for each grid node. Thus, the set of varied parameters and the range of their variation is determined by the logic of a particular study and represents a significant narrowing of the full set of initial conditions for which the model allows simulation experiments.
…
Displaying 10 of 556 results for "Niklas Hase" clear search