Our mission is to help computational modelers develop, document, and share their computational models in accordance with community standards and good open science and software engineering practices. Model authors can publish their model source code in the Computational Model Library with narrative documentation as well as metadata that supports open science and emerging norms that facilitate software citation, computational reproducibility / frictionless reuse, and interoperability. Model authors can also request private peer review of their computational models. Models that pass peer review receive a DOI once published.
All users of models published in the library must cite model authors when they use and benefit from their code.
Please check out our model publishing tutorial and feel free to contact us if you have any questions or concerns about publishing your model(s) in the Computational Model Library.
Displaying 10 of 556 results for "Niklas Hase" clear search
ForagerNet3_Demography_V3
Andrew White | Published Tuesday, November 29, 2016The ForagerNet3_Demography model is a non-spatial ABM designed to serve as a platform for exploring several aspects of hunter-gatherer demography.
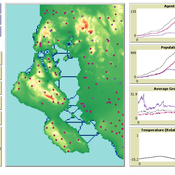
Agent-based model for the socio-economic monitoring of visitor streams
Stefan Mohr | Published Saturday, January 20, 2018Due to the large extent of the Harz National Park, an accurate measurement of visitor numbers and their spatiotemporal distribution is not feasible. This model demonstrates the possibility to simulate the streams of visitors with ABM methodology.
SeaROOTS ABM: Simulating Artificial Hominins Maritime Mobility at Inner Ionian, Greece
Angelos Chliaoutakis | Published Wednesday, May 29, 2024SeaROOTS ABM is a quite generic agent-based modeling system, for simulating and evaluating potential terrestrial and maritime mobility of artificial hominin groups, configured by available archaeological data and hypotheses. Necessary bathymetric, geomorphological and paleoenvironmental data are combined in order to reconstruct paleoshorelines for the study area and produce an archaeologically significant agent environment. Paleoclimatic and archaeological data are incorporated in the ABM in order to simulate maritime crossings and assess the emergent patterns of interaction between human agency and the sea.
SeaROOTS agent-based system includes completely autonomous, utility-based agents (Chliaoutakis & Chalkiadakis 2016), representing artificial hominin groups, with partial knowledge of their environment, for simulating their evolution and potential maritime mobility, utilizing alternative Least Cost Path analysis modeling techniques (Gustas & Supernant 2017, Gravel-Miguel & Wren 2021). Two groups of hominins, Neanderthals and Homo sapiens, are chosen in order to study the challenges and actions employed as a response to the fluctuating sea-levels, as well as probability scenarios with respect to sea-crossings via buoyant vessels (rafting) or the human body itself (swimming). SeaROOTS ABM aims to simulate various scenarios and investigate the degree climatic fluctuations influenced such activities and interactions in the Middle Paleolithic period.
The model focuses on simulating potential terrestrial and maritime routes, explore the interactions and relations between autonomous agents and their environment, as well as to test specific research questions; for example, when and under what conditions would Middle Paleolithic hominins be more likely to attempt a crossing and successfully reach the islands? By which agent type (Sapiens or Neanderthals) and how (e.g. swimming or by sea-vessels) could such short sea crossings be (mostly) attempted, and which (sea) routes were usually considered by the agents? When does a sea-crossing become a choice and when is it a result of forced migration, i.e. disaster- or conflict-induced displacement? Results show that the dynamic marine environment of the Inner Ionian, our case study in this work, played an important role in their decision-making process.
Shellmound Mobility
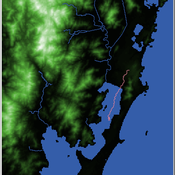
Henrique de Sena Kozlowski | Published Saturday, June 15, 2024Least Cost Path (LCP) analysis is a recurrent theme in spatial archaeology. Based on a cost of movement image, the user can interpret how difficult it is to travel around in a landscape. This kind of analysis frequently uses GIS tools to assess different landscapes. This model incorporates some aspects of the LCP analysis based on GIS with the capabilities of agent-based modeling, such as the possibility to simulate random behavior when moving. In this model the agent will travel around the coastal landscape of Southern Brazil, assessing its path based on the different cost of travel through the patches. The agents represent shellmound builders (sambaquieiros), who will travel mainly through the use of canoes around the lagoons.
How it works?
When the simulation starts the hiker agent moves around the world, a representation of the lagoon landscape of the Santa Catarina state in Southern Brazil. The agent movement is based on the travel cost of each patch. This travel cost is taken from a cost surface raster created in ArcMap to represent the different cost of movement around the landscape. Each tick the agent will have a chance to select the best possible patch to move in its Field of View (FOV) that will take it towards its target destination. If it doesn’t select the best possible patch, it will randomly choose one of the patches to move in its FOV. The simulation stops when the hiker agent reaches the target destination. The elevation raster file and the cost surface map are based on a 1 Arc-second (30m) resolution SRTM image, scaled down 5 times. Each patch represents a square of 150m, with an area of 0,0225km². The dataset uses a UTM Sirgas 2000 22S projection system. There are four different cost functions available to use. They change the cost surface used by the hikers to navigate around the world.
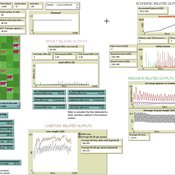
Peer reviewed soslivestock model
Marco Janssen Irene Perez Ibarra Diego J. Soler-Navarro Alicia Tenza Peral | Published Wednesday, May 28, 2025 | Last modified Tuesday, June 10, 2025The purpose of this model is to analyze how different management strategies affect the wellbeing, sustainability and resilience of an extensive livestock system under scenarios of climate change and landscape configurations. For this purpose, it simulates one cattle farming system, in which agents (cattle) move through the space using resources (grass). Three farmer profiles are considered: 1) a subsistence farmer that emphasizes self-sufficiency and low costs with limited attention to herd management practices, 2) a commercial farmer focused on profit maximization through efficient production methods, and 3) an environmental farmer that prioritizes conservation of natural resources and animal welfare over profit maximization. These three farmer profiles share the same management strategies to adapt to climate and resource conditions, but differ in their goals and decision-making criteria for when, how, and whether to implement those strategies. This model is based on the SequiaBasalto model (Dieguez Cameroni et al. 2012, 2014, Bommel et al. 2014 and Morales et al. 2015), replicated in NetLogo by Soler-Navarro et al. (2023).
One year is 368 days. Seasons change every 92 days. Each step begins with the growth of grass as a function of climate and season. This is followed by updating the live weight of animals according to the grass height of their patch, and grass consumption, which is determined based on the updated live weight. Animals can be supplemented by the farmer in case of severe drought. After consumption, cows grow and reproduce, and a new grass height is calculated. This updated grass height value becomes the starting grass height for the next day. Cows then move to the next area with the highest grass height. After that, cattle prices are updated and cattle sales are held on the first day of fall. In the event of a severe drought, special sales are held. Finally, at the end of the day, the farm balance and the farmer’s effort are calculated.
An agent-based model to simulate field-specific nitrogen fertilizer applications in grasslands
Maria Haensel Thomas Schmitt Andrea Kaim Sylvia Helena Annuth Thomas Koellner | Published Sunday, February 09, 2025Grasslands have a large share of the world’s land cover and their sustainable management is important for the protection and provisioning of grassland ecosystem services. The question of how to manage grassland sustainably is becoming increasingly important, especially in view of climate change, which on the one hand extends the vegetation period (and thus potentially allows use intensification) and on the other hand causes yield losses due to droughts. Fertilization plays an important role in grassland management and decisions are usually made at farm level. Data on fertilizer application rates are crucial for an accurate assessment of the effects of grassland management on ecosystem services. However, these are generally not available on farm/field scale. To close this gap, we present an agent-based model for Fertilization In Grasslands (FertIG). Based on animal, land-use, and cutting data, the model estimates grassland yields and calculates field-specific amounts of applied organic and mineral nitrogen on grassland (and partly cropland). Furthermore, the model considers different legal requirements (including fertilization ordinances) and nutrient trade among farms. FertIG was applied to a grassland-dominated region in Bavaria, Germany comparing the effects of changes in the fertilization ordinance as well as nutrient trade. The results show that the consideration of nutrient trade improves organic fertilizer distribution and leads to slightly lower Nmin applications. On a regional scale, recent legal changes (fertilization ordinance) had limited impacts. Limiting the maximum applicable amount of Norg to 170 kg N/ha fertilized area instead of farm area as of 2020 hardly changed fertilizer application rates. No longer considering application losses in the calculation of fertilizer requirements had the strongest effects, leading to lower supplementary Nmin applications. The model can be applied to other regions in Germany and, with respective adjustments, in Europe. Generally, it allows comparing the effects of policy changes on fertilization management at regional, farm and field scale.
02 OamLab V1.10 - Open Atwood Machine Laboratory
Garvin Boyle | Published Saturday, January 31, 2015 | Last modified Thursday, April 13, 2017Using chains of replicas of Atwood’s Machine, this model explores implications of the Maximum Power Principle. It is one of a series of models exploring the dynamics of sustainable economics – PSoup, ModEco, EiLab, OamLab, MppLab, TpLab, EiLab.
03 MppLab V1.09 – Maximum Power Principle Laboratory
Garvin Boyle | Published Saturday, April 15, 2017Using webs of replicas of Atwood’s Machine, we explore implications of the Maximum Power Principle. This is one of a series of models exploring the dynamics of sustainable economics – PSoup, ModEco, EiLab, OamLab, MppLab, TpLab, CmLab.
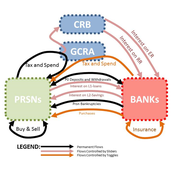
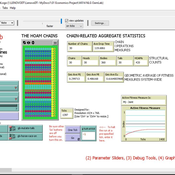
05 CmLab V1.17 – Conservation of Money Laboratory
Garvin Boyle | Published Saturday, April 15, 2017In CmLab we explore the implications of the phenomenon of Conservation of Money in a modern economy. This is one of a series of models exploring the dynamics of sustainable economics – PSoup, ModEco, EiLab, OamLab, MppLab, TpLab, CmLab.
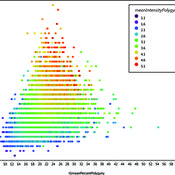
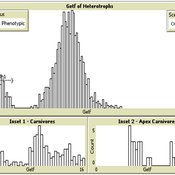
Talent vs Luck: the role of randomness in success and failure
Alessandro Pluchino Alessio Emanuele Biondo Andrea Rapisarda | Published Monday, July 16, 2018The largely dominant meritocratic paradigm of highly competitive Western cultures is rooted on the belief that success is due mainly, if not exclusively, to personal qualities such as talent, intelligence, skills, smartness, efforts, willfulness, hard work or risk taking. Sometimes, we are willing to admit that a certain degree of luck could also play a role in achieving significant material success. But, as a matter of fact, it is rather common to underestimate the importance of external forces in individual successful stories. It is very well known that intelligence (or, more in general, talent and personal qualities) exhibits a Gaussian distribution among the population, whereas the distribution of wealth - often considered a proxy of success - follows typically a power law (Pareto law), with a large majority of poor people and a very small number of billionaires. Such a discrepancy between a Normal distribution of inputs, with a typical scale (the average talent or intelligence), and the scale invariant distribution of outputs, suggests that some hidden ingredient is at work behind the scenes. In a recent paper, with the help of this very simple agent-based model realized with NetLogo, we suggest that such an ingredient is just randomness. In particular, we show that, if it is true that some degree of talent is necessary to be successful in life, almost never the most talented people reach the highest peaks of success, being overtaken by mediocre but sensibly luckier individuals. As to our knowledge, this counterintuitive result - although implicitly suggested between the lines in a vast literature - is quantified here for the first time. It sheds new light on the effectiveness of assessing merit on the basis of the reached level of success and underlines the risks of distributing excessive honors or resources to people who, at the end of the day, could have been simply luckier than others. With the help of this model, several policy hypotheses are also addressed and compared to show the most efficient strategies for public funding of research in order to improve meritocracy, diversity and innovation.
Displaying 10 of 556 results for "Niklas Hase" clear search