Our mission is to help computational modelers develop, document, and share their computational models in accordance with community standards and good open science and software engineering practices. Model authors can publish their model source code in the Computational Model Library with narrative documentation as well as metadata that supports open science and emerging norms that facilitate software citation, computational reproducibility / frictionless reuse, and interoperability. Model authors can also request private peer review of their computational models. Models that pass peer review receive a DOI once published.
All users of models published in the library must cite model authors when they use and benefit from their code.
Please check out our model publishing tutorial and feel free to contact us if you have any questions or concerns about publishing your model(s) in the Computational Model Library.
Displaying 10 of 509 results for "Tim M Daw" clear search
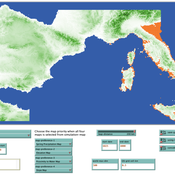
Geographic Expansion Model (GEM)
Sean Bergin | Published Friday, February 28, 2020The purpose of this model is to explore the importance of geographic factors to the settlement choices of early Neolithic agriculturalists. In the model, each agriculturalist spreads to one of the best locations within a modeler specified radius. The best location is determined by choosing either one factor such as elevation or slope; or by ranking geographic factors in order of importance.
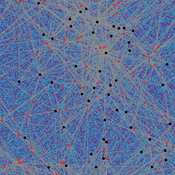
Cultural Evolution of Sustainable Behaviours: Landscape of Affordances Model
Nikita Strelkovskii Roope Oskari Kaaronen | Published Wednesday, December 04, 2019 | Last modified Wednesday, December 04, 2019This NetLogo model illustrates the cultural evolution of pro-environmental behaviour patterns. It illustrates how collective behaviour patterns evolve from interactions between agents and agents (in a social network) as well as agents and the affordances (action opportunities provided by the environment) within a niche. More specifically, the cultural evolution of behaviour patterns is understood in this model as a product of:
- The landscape of affordances provided by the material environment,
- Individual learning and habituation,
- Social learning and network structure,
- Personal states (such as habits and attitudes), and
…
Peer reviewed Labor and environment in global value chains: An evolutionary policy study with a three-sector and two-region agent-based macroeconomic model
Lena Gerdes Manuel Scholz-Wäckerle Bernhard Rengs | Published Wednesday, December 22, 2021With this model, we investigate resource extraction and labor conditions in the Global South as well as implications for climate change originating from industry emissions in the North. The model serves as a testbed for simulation experiments with evolutionary political economic policies addressing these issues. In the model, heterogeneous agents interact in a self-organizing and endogenously developing economy. The economy contains two distinct regions – an abstract Global South and Global North. There are three interlinked sectors, the consumption good–, capital good–, and resource production sector. Each region contains an independent consumption good sector, with domestic demand for final goods. They produce a fictitious consumption good basket, and sell it to the households in the respective region. The other sectors are only present in one region. The capital good sector is only found in the Global North, meaning capital goods (i.e. machines) are exclusively produced there, but are traded to the foreign as well as the domestic market as an intermediary. For the production of machines, the capital good firms need labor, machines themselves and resources. The resource production sector, on the other hand, is only located in the Global South. Mines extract resources and export them to the capital firms in the North. For the extraction of resources, the mines need labor and machines. In all three sectors, prices, wages, number of workers and physical capital of the firms develop independently throughout the simulation. To test policies, an international institution is introduced sanctioning the polluting extractivist sector in the Global South as well as the emitting industrial capital good producers in the North with the aim of subsidizing innovation reducing environmental and social impacts.
DARTS: an agent-based model of the global food system for studying its resilience to shocks
Hubert Fonteijn | Published Wednesday, November 22, 2023DARTS simulates food systems in which agents produce, consume and trade food. Here, food is a summary item that roughly corresponds to commodity food types (e.g. rice). No other food types are taken into account. Each food system (World) consists of its own distribution of agents, regions and connections between agents. Agents differ in their ability to produce food, earn off-farm income and trade food. The agents aim to satisfy their food requirements (which are fixed and equal across agents) by either their own food production or by food purchases. Each simulation step represents one month, in which agents can produce (if they have productive capacity and it is a harvest month for their region), earn off-farm income, trade food (both buy and sell) and consume food. We evaluate the performance of the food system by averaging the agents’ food satisfaction, which is defined as the ratio of the food consumed by each agent at the end of each month divided by her food requirement. At each step, any of the abovementioned attributes related to the agents’ ability to satisfy their food requirement can (temporarily) be shocked. These shocks include reducing the amount of food they produce, removing their ability to trade locally or internationally and reducing their cash savings. Food satisfaction is quantified (both immediately after the shock and in the year following the shock) to evaluate food security of a particular food system, both at the level of agent types (e.g. the urban poor and the rural poor) and at the systems level. Thus, the effects of shocks on food security can be related to the food system’s structure.
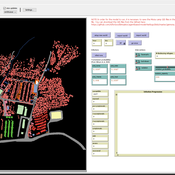
AIforGoodSimulator - Modeling Covid-19 Spread and Potential Interventions in Refugee Camps
Shyaam Ramkumar Woi Sok Oh | Published Thursday, March 18, 2021The Netlogo model is a conceptualization of the Moria refugee camp, capturing the household demographics of refugees in the camp, a theoretical friendship network based on values, and an abstraction of their daily activities. The model then simulates how Covid-19 could spread through the camp if one refugee is exposed to the virus, utilizing transmission probabilities and the stages of disease progression of Covid-19 from susceptible to exposed to asymptomatic / symptomatic to mild / severe to recovered from literature. The model also incorporates various interventions - PPE, lockdown, isolation of symptomatic refugees - to analyze how they could mitigate the spread of the virus through the camp.
Artificial Long House Valley-Black Mesa
Lisa Sattenspiel Amy Warren | Published Thursday, March 19, 2020This model is an extension of the Artificial Long House Valley (ALHV) model developed by the authors (Swedlund et al. 2016; Warren and Sattenspiel 2020). The ALHV model simulates the population dynamics of individuals within the Long House Valley of Arizona from AD 800 to 1350. Individuals are aggregated into households that participate in annual agricultural and demographic cycles. The present version of the model incorporates features of the ALHV model including realistic age-specific fertility and mortality and, in addition, it adds the Black Mesa environment and population, as well as additional methods to allow migration between the two regions.
As is the case for previous versions of the ALHV model as well as the Artificial Anasazi (AA) model from which the ALHV model was derived (Axtell et al. 2002; Janssen 2009), this version makes use of detailed archaeological and paleoenvironmental data from the Long House Valley and the adjacent areas in Arizona. It also uses the same methods as the original AA model to estimate annual maize productivity of various agricultural zones within the Long House Valley. A new environment and associated methods have been developed for Black Mesa. Productivity estimates from both regions are used to determine suitable locations for households and farms during each year of the simulation.
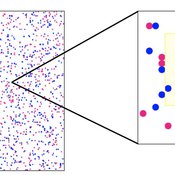
Human mate choice is a complex system
Paul Smaldino Jeffrey C Schank | Published Friday, February 08, 2013 | Last modified Saturday, April 27, 2013A general model of human mate choice in which agents are localized in space, interact with close neighbors, and tend to range either near or far. At the individual level, our model uses two oft-used but incompletely understood decision rules: one based on preferences for similar partners, the other for maximally attractive partners.
ForagerNet3_Demography: A Non-Spatial Model of Hunter-Gatherer Demography
Andrew White | Published Thursday, October 17, 2013 | Last modified Thursday, October 17, 2013ForagerNet3_Demography is a non-spatial ABM for exploring hunter-gatherer demography. Key methods represent birth, death, and marriage. The dependency ratio is an imporant variable in many economic decisions embedded in the methods.
Mobility USA (MUSA)
Giangiacomo Bravo Davide Natalini | Published Sunday, December 08, 2013 | Last modified Monday, December 30, 2013MUSA is an ABM that simulates the commuting sector in USA. A multilevel validation was implemented. Social network with a social-circle structure included. Two types of policies have been tested: market-based and preference-change.
ForagerNet3_Demography_V2
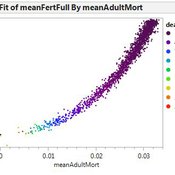
Andrew White | Published Thursday, February 13, 2014ForagerNet3_Demography_V2 is a non-spatial ABM for exploring hunter-gatherer demography. This version (developed from FN3D_V1) contains code for calculating the ratio of old to young adults (the “OY ratio”) in the living and dead populations.
Displaying 10 of 509 results for "Tim M Daw" clear search