Our mission is to help computational modelers develop, document, and share their computational models in accordance with community standards and good open science and software engineering practices. Model authors can publish their model source code in the Computational Model Library with narrative documentation as well as metadata that supports open science and emerging norms that facilitate software citation, computational reproducibility / frictionless reuse, and interoperability. Model authors can also request private peer review of their computational models. Models that pass peer review receive a DOI once published.
All users of models published in the library must cite model authors when they use and benefit from their code.
Please check out our model publishing tutorial and feel free to contact us if you have any questions or concerns about publishing your model(s) in the Computational Model Library.
Displaying 10 of 528 results for "Mark Orr" clear search
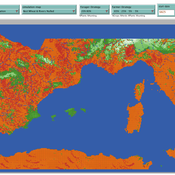
Peer reviewed The foraging potential of the Holocene Cape South Coast of South Africa without the Palaeo-Agulhas Plain
Marco Janssen Colin Wren | Published Monday, August 12, 2019The Palaeo-Agulhas Plain formed an important habitat exploited by Pleistocene hunter-gatherer populations during periods of lower sea level. This productive, grassy habitat would have supported numerous large-bodied ungulates accessible to a population of skilled hunters with the right hunting technology. It also provided a potentially rich location for plant food collection, and along its shores a coastline that moved with the rise and fall of sea levels. The rich archaeological and paleontological records of Pleistocene sites along the modern Cape south coast of South Africa, which would have overlooked the Palaeo-Agulhas Plain during Pleistocene times of lower sea level, provides a paleoarchive of this extinct ecosystem. In this paper, we present a first order illustration of the “palaeoscape modeling” approach advocated by Marean et al. (2015). We use a resourcescape model created from modern studies of habitat productivity without the Palaeo-Agulhas Plain. This is equivalent to predominant Holocene conditions. We then run an agent-based model of the human foraging system to investigate several research questions. Our agent-based approach uses the theoretical framework of optimal foraging theory to model human foraging decisions designed to optimize the net caloric gains within a complex landscape of spatially and temporally variable resources. We find that during the high sea-levels of MIS 5e (+5-6 m asl) and the Holocene, the absence of the Plain left a relatively poor food base supporting a much smaller population relying heavily on edible plant resources from the current Cape flora. Despite high species diversity of plants with edible storage organs, and marine invertebrates, encounter rates with highly profitable resources were low. We demonstrate that without the Palaeo-Agulhas Plain, human populations must have been small and low density, and exploited plant, mammal, and marine resources with relatively low caloric returns. The exposure and contraction of the Palaeo-Agulhas Plain was likely the single biggest driver of behavioral change during periods of climate change through the Pleistocene and into the transition to the Holocene.
Covid-19-Belief-network-Hybrid-Model
Morteza Mahmoudzadeh | Published Sunday, September 05, 2021Digital social networks facilitate the opinion dynamics and idea flow and also provide reliable data to understand these dynamics. Public opinion and cooperation behavior are the key factors to determine the capacity of a successful and effective public policy. In particular, during the crises, such as the Corona virus pandemic, it is necessary to understand the people’s opinion toward a policy and the performance of the governance institutions. The problem of the mathematical explanation of the human behaviors is to simplify and bypass some of the essential process. To tackle this problem, we adopted a data-driven strategy to extract opinion and behavioral patterns from social media content to reflect the dynamics of society’s average beliefs toward different topics. We extracted important subtopics from social media contents and analyze the sentiments of users at each subtopic. Subsequently, we structured a Bayesian belief network to demonstrate the macro patters of the beliefs, opinions, information and emotions which trigger the response toward a prospective policy. We aim to understand the factors and latent factors which influence the opinion formation in the society. Our goal is to enhance the reality of the simulations. To capture the dynamics of opinions at an artificial society we apply agent-based opinion dynamics modeling. We intended to investigate practical implementation scenarios of this framework for policy analysis during Corona Virus Pandemic Crisis. The implemented modular modeling approach could be used as a flexible data-driven policy making tools to investigate public opinion in social media. The core idea is to put the opinion dynamics in the wider contexts of the collective decision-making, data-driven policy-modeling and digital democracy. We intended to use data-driven agent-based modeling as a comprehensive analysis tools to understand the collective opinion dynamics and decision making process on the social networks and uses this knowledge to utilize network-enabled policy modeling and collective intelligence platforms.
Societal Simulator v203
Tim Gooding | Published Tuesday, October 01, 2013 | Last modified Friday, November 28, 2014Designed to capture the evolutionary forces of global society.
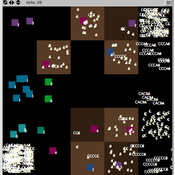
The Cardial Spread Model
Sean Bergin | Published Friday, September 29, 2017 | Last modified Monday, February 04, 2019The purpose of this model is to provide a platform to test and compare four conceptual models have been proposed to explain the spread of the Impresso-Cardial Neolithic in the west Mediterranean.
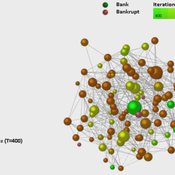
Dynamic Interbank Network Simulator
Valentina Guleva | Published Wednesday, November 23, 2016 | Last modified Monday, April 13, 2020The model provides instruments for the simulation of interbank network evolution. There are tools for dynamic network analysis, allowing to evaluate graph topological invariants, thermodynamic network features and combinational node-based features.
SBH trust model
Di Wang | Published Tuesday, December 14, 2010 | Last modified Saturday, April 27, 2013This is a computational model to articulate the theory and test some assumption and axioms for the trust model and its relationship to SBH.
An empirical ABM for regional land use/cover change: a Dutch case study
Diego Valbuena | Published Saturday, March 12, 2011 | Last modified Thursday, November 11, 2021This is an empirical model described in http://dx.doi.org/10.1016/j.landurbplan.2010.05.001. The objective of the model is to simulate how the decision-making of farmers/agents with different strategies can affect the landscape structure in a region in the Netherlands.
DiDIY Factory
Ruth Meyer | Published Tuesday, February 20, 2018The DiDIY-Factory model is a model of an abstract factory. Its purpose is to investigate the impact Digital Do-It-Yourself (DiDIY) could have on the domain of work and organisation.
DiDIY can be defined as the set of all manufacturing activities (and mindsets) that are made possible by digital technologies. The availability and ease of use of digital technologies together with easily accessible shared knowledge may allow anyone to carry out activities that were previously only performed by experts and professionals. In the context of work and organisations, the DiDIY effect shakes organisational roles by such disintermediation of experts. It allows workers to overcome the traditionally strict organisational hierarchies by having direct access to relevant information, e.g. the status of machines via real-time information systems implemented in the factory.
A simulation model of this general scenario needs to represent a more or less abstract manufacturing firm with supervisors, workers, machines and tasks to be performed. Experiments with such a model can then be run to investigate the organisational structure –- changing from a strict hierarchy to a self-organised, seemingly anarchic organisation.
FlipFlop1-ProMEERB: A coupled social-ecological model with a promotional mechanism for emergence of environmentally responsible behavior
Liliana Perez Saeed Harati Roberto Molowny-Horas | Published Friday, December 17, 2021At the heart of a study of Social-Ecological Systems, this model is built by coupling together two independently developed models of social and ecological phenomena. The social component of the model is an abstract model of interactions of a governing agent and several user agents, where the governing agent aims to promote a particular behavior among the user agents. The ecological model is a spatial model of spread of the Mountain Pine Beetle in the forests of British Columbia, Canada. The coupled model allowed us to simulate various hypothetical management scenarios in a context of forest insect infestations. The social and ecological components of this model are developed in two different environments. In order to establish the connection between those components, this model is equipped with a ‘FlipFlop’ - a structure of storage directories and communication protocols which allows each of the models to process its inputs, send an output message to the other, and/or wait for an input message from the other, when necessary. To see the publications associated with the social and ecological components of this coupled model please see the References section.
Peer reviewed Personnel decisions in the hierarchy
Smarzhevskiy Ivan | Published Friday, August 19, 2022This is a model of organizational behavior in the hierarchy in which personnel decisions are made.
The idea of the model is that the hierarchy, busy with operations, is described by such characteristics as structure (number and interrelation of positions) and material, filling these positions (persons with their individual performance). A particular hierarchy is under certain external pressure (performance level requirement) and is characterized by the internal state of the material (the distribution of the perceptions of others over the ensemble of persons).
The World of the model is a four-level hierarchical structure, consisting of shuff positions of the top manager (zero level of the hierarchy), first-level managers who are subordinate to the top manager, second-level managers (subordinate to the first-level managers) and positions of employees (the third level of the hierarchy). ) subordinated to the second-level managers. Such a hierarchy is a tree, i.e. each position, with the exception of the position of top manager, has a single boss.
Agents in the model are persons occupying the specified positions, the number of persons is set by the slider (HumansQty). Personas have some operational performance (harisma, an unfortunate attribute name left over from the first edition of the model)) and a sense of other personas’ own perceptions. Performance values are distributed over the ensemble of persons according to the normal law with some mean value and variance.
The value of perception by agents of each other is positive or negative (implemented in the model as numerical values equal to +1 and -1). The distribution of perceptions over an ensemble of persons is implemented as a random variable specified by the probability of negative perception, the value of which is set by the control elements of the model interface. The numerical value of the probability equal to 0 corresponds to the case in which all persons positively perceive each other (the numerical value of the random variable is equal to 1, which corresponds to the positive perception of the other person by the individual).
The hierarchy is occupied with operational activity, the degree of intensity of which is set by the external parameter Difficulty. The level of productivity of each manager OAIndex is equal to the level of productivity of the department he leads and is the ratio of the sum of productivity of employees subordinate to the head to the level of complexity of the work Difficulty. An increase in the numerical value of Difficulty leads to a decrease in the OAIndex for all subdivisions of the hierarchy. The managerial meaning of the OAIndex indicator is the percentage of completion of the load specified for the hierarchy as a whole, i.e. the ratio of the actual performance of the structural subdivisions of the hierarchy to the required performance, the level of which is specified by the value of the Difficulty parameter.
…
Displaying 10 of 528 results for "Mark Orr" clear search