Our mission is to help computational modelers develop, document, and share their computational models in accordance with community standards and good open science and software engineering practices. Model authors can publish their model source code in the Computational Model Library with narrative documentation as well as metadata that supports open science and emerging norms that facilitate software citation, computational reproducibility / frictionless reuse, and interoperability. Model authors can also request private peer review of their computational models. Models that pass peer review receive a DOI once published.
All users of models published in the library must cite model authors when they use and benefit from their code.
Please check out our model publishing tutorial and feel free to contact us if you have any questions or concerns about publishing your model(s) in the Computational Model Library.
Displaying 10 of 958 results for "Jan Van Bavel" clear search
Peer reviewed The Indus Village's Weather model: procedural generation of daily weather
Andreas Angourakis | Published Tuesday, May 13, 2025Overview
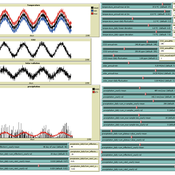
The Weather model is a procedural generation model designed to create realistic daily weather data for socioecological simulations. It generates synthetic weather time series for solar radiation, temperature, and precipitation using algorithms based on sinusoidal and double logistic functions. The model incorporates stochastic variation to mimic unpredictable weather patterns and aims to provide realistic yet flexible weather inputs for exploring diverse climate scenarios.
The Weather model can be used independently or integrated into larger models, providing realistic weather patterns without extensive coding or data collection. It can be customized to meet specific requirements, enabling users to gain a better understanding of the underlying mechanisms and have greater confidence in their applications.
…
A Consumer in the Jungle of Product Differentiation
Alessandro Pluchino Andrea Rapisarda Alessio Emanuele Biondo Alfio Giarlotta | Published Tuesday, December 22, 2015Building upon the distance-based Hotelling’s differentiation idea, we describe the behavioral experience of several prototypes of consumers, who walk a hypothetical cognitive path in an attempt to maximize their satisfaction.
Agent-based model of repeated conservation auctions in low-income countries
Sebastian Rasch Elsa Cardona Hugo Storm | Published Sunday, March 22, 2020Our model allows simulating repeated conservation auctions in low-income countries. It is designed to assess policy-making by exploring the extent to which non-targeted repeated auctions can provide biodiversity conservation cost-effectively, while alleviating poverty. Targeting landholders in order to integrate both goals is claimed to be overambitious and underachieving because of the trade-offs they imply. The simulations offer insight on the possible outcomes that can derive from implementing conservation auctions in low-income countries, where landholders are likely to be risk averse and to face uncertainty.
FlowLogo for a real case study
Vahid Aghaie | Published Monday, May 18, 2020Juan Castilla-Rho et al. (2015) developed a platform, named FLowLogo, which integrates a 2D, finite-difference solution of the governing equations of groundwater flow with agent-based simulation. We used this model for Rafsanjan Aquifer, which is located in an arid region in Iran. To use FLowLogo for a real case study, one needs to add GIS shapefiles of boundary conditions and modify the code written in NetLogo a little bit. The FlowLogo model used in our research is presented here.
NarrABS
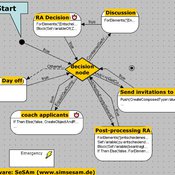
Tilman Schenk | Published Thursday, September 20, 2012 | Last modified Saturday, April 27, 2013An agent based simulation of a political process based on stakeholder narratives
Unified Opinion Dynamics Simulator
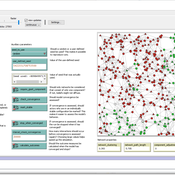
Adam Coates | Published Wednesday, June 20, 2018This is a simulator for the unified opinion dynamics framework, as developed by Adam Coates, Anthony Kleerekoper, and Liangxiu Han.
Peer reviewed A Model of Global Diversity and Local Consensus in Status Beliefs
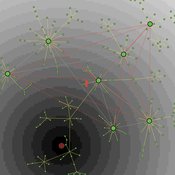
André Grow Andreas Flache Rafael Wittek | Published Wednesday, March 01, 2017 | Last modified Wednesday, October 25, 2017This model makes it possible to explore how network clustering and resistance to changing existing status beliefs might affect the spontaneous emergence and diffusion of such beliefs as described by status construction theory.
Peer reviewed Neighbor Influenced Energy Retrofit (NIER) agent-based model
Eric Boria | Published Friday, April 03, 2020The NIER model is intended to add qualitative variables of building owner types and peer group scales to existing energy efficiency retrofit adoption models. The model was developed through a combined methodology with qualitative research, which included interviews with key stakeholders in Cleveland, Ohio and Detroit and Grand Rapids, Michigan. The concepts that the NIER model adds to traditional economic feasibility studies of energy retrofit decision-making are differences in building owner types (reflecting strategies for managing buildings) and peer group scale (neighborhoods of various sizes and large-scale Districts). Insights from the NIER model include: large peer group comparisons can quickly raise the average energy efficiency values of Leader and Conformist building owner types, but leave Stigma-avoider owner types as unmotivated to retrofit; policy interventions such as upgrading buildings to energy-related codes at the point of sale can motivate retrofits among the lowest efficient buildings, which are predominantly represented by the Stigma-avoider type of owner; small neighborhood peer groups can successfully amplify normal retrofit incentives.
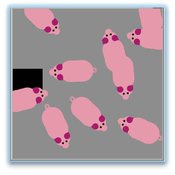
Tail biting behaviour in pigs
Iris J.M.M. Boumans Iris Jmm Boumans | Published Friday, April 22, 2016 | Last modified Wednesday, September 14, 2016The model simulates tail biting behaviour in pigs and how they can turn into a biter and/or victim. The effect of a redirected motivation, behavioural changes in victims and preference to bite a lying pig on tail biting can be tested in the model
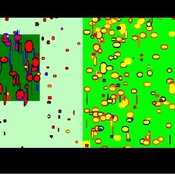
Sociodynamica in a Browser
Klaus Jaffe | Published Saturday, December 24, 2016Sociodynamica simulates the emergence of cooperation and of economic interactions, showing the synergy achieved by division of labor, the working of shame, and a number of other features that mold the evolution of social cooperation.
Displaying 10 of 958 results for "Jan Van Bavel" clear search