Our mission is to help computational modelers develop, document, and share their computational models in accordance with community standards and good open science and software engineering practices. Model authors can publish their model source code in the Computational Model Library with narrative documentation as well as metadata that supports open science and emerging norms that facilitate software citation, computational reproducibility / frictionless reuse, and interoperability. Model authors can also request private peer review of their computational models. Models that pass peer review receive a DOI once published.
All users of models published in the library must cite model authors when they use and benefit from their code.
Please check out our model publishing tutorial and feel free to contact us if you have any questions or concerns about publishing your model(s) in the Computational Model Library.
Displaying 10 of 142 results spatial clear search
Agent-based modeling of the spatio-temporal distribution of Sahelian transhumant herds
Cheick Amed Diloma Gabriel TRAORE Etienne DELAY Alassane Bah Djibril Diop | Published Tuesday, May 20, 2025Sahelian transhumance is a seasonal pastoral mobility between the transhumant’s terroir of origin and one or more host terroirs. Sahelian transhumance can last several months and extend over hundreds of kilometers. Its purpose is to ensure efficient and inexpensive feeding of the herd’s ruminants. This paper describes an agent-based model to determine the spatio-temporal distribution of Sahelian transhumant herds and their impact on vegetation. Three scenarios based on different values of rainfall and the proportion of vegetation that can be grazed by transhumant herds are simulated. The results of the simulations show that the impact of Sahelian transhumant herds on vegetation is not significant and that rainfall does not impact the alley phase of transhumance. The beginning of the rainy season has a strong temporal impact on the spatial distribution of transhumant herds during the return phase of transhumance.
Transfer of Development Rights (TDR) Simulation for Compact Urban Growth in Dublin: An Agent-Based Model in NetLogo
ajithvyas | Published Wednesday, May 14, 2025This agent-based model simulates the implementation of a Transfer of Development Rights (TDR) mechanism in a stylized urban environment inspired by Dublin. It explores how developer agents interact with land parcels under spatial zoning, conservation protections, and incentive-based policy rules. The model captures emergent outcomes such as compact growth, green and heritage zone preservation, and public cost-efficiency. Built in NetLogo, the model enables experimentation with variable FSI bonuses, developer behavior, and spatial alignment of sending/receiving zones. It is intended as a policy sandbox to test market-aligned planning tools under behavioral and spatial uncertainty.
Peer reviewed Evolution of Conditional Cooperation in a Spatial Public Goods Game
Marco Janssen Francesca Federico Raksha Balakrishna | Published Saturday, March 15, 2025A model to investigate the Evolution of Conditional Cooperation in a Spatial Public Goods Game. We consider two conditional cooperation strategies: one based on thresholds (Battu & Srinivasan, 2020) and another based on independent decisions for each number of cooperating neighbors. We examine the effects of productivity and conditional cooperation criteria on the trajectory of cooperation. Cooperation is evolving with no need for additional mechanisms apart from spatial structure when agents follow conditional strategies. We confirm the positive influence of productivity and cluster formation on the evolution of cooperation in spatial models. Results are robust for the two types of conditional cooperation strategies.
Peer reviewed Environmental stochasticity, resource heterogeneity, and the evolution of cooperation
Michaela Starkey Colin Lynch Terry Hunt Carl Lipo | Published Friday, March 14, 2025 | Last modified Wednesday, July 30, 2025The emergence of cooperation in human societies is often linked to environmental constraints, yet the specific conditions that promote cooperative behavior remain an open question. This study examines how resource unpredictability and spatial dispersion influence the evolution of cooperation using an agent-based model (ABM). Our simulations test the effects of rainfall variability and resource distribution on the survival of cooperative and non-cooperative strategies. The results show that cooperation is most likely to emerge when resources are patchy, widely spaced, and rainfall is unpredictable. In these environments, non-cooperators rapidly deplete local resources and face high mortality when forced to migrate between distant patches. In contrast, cooperators—who store and share resources—can better endure extended droughts and irregular resource availability. While rainfall stochasticity alone does not directly select for cooperation, its interaction with resource patchiness and spatial constraints creates conditions where cooperative strategies provide a survival advantage. These findings offer broader insights into how environmental uncertainty shapes social organization in resource-limited settings. By integrating ecological constraints into computational modeling, this study contributes to a deeper understanding of the conditions that drive cooperation across diverse human and animal systems.
Construction and Demolition model to track material flows and embodied carbon
Jonathan Edgardo Cohen | Published Monday, September 30, 2024Reusing existing material stocks in developed built environments can significantly reduce the environmental footprint of the construction and demolition sector. However, material reuse in urban areas presents technical, temporal, and geographical challenges. Although a better understanding of spatial and temporal changes in material stocks could improve city resource management, limited scientific contributions have addressed this challenge.
This study details the steps followed in developing a spatially explicit rule-based simulation of materials stock. The simulation provides a proof of concept by incorporating the spatial and temporal dimensions of construction and demolition activities to analyse how various urban parameters determine material flows and embodied carbon in urban areas. The model explores the effects of 1) re-using recycled materials, 2) demolitions, 3) renovations and 4) various building typologies.
To showcase the model’s capabilities, the residential building stock of Gothenburg City is used as a case study, and eight building materials are tracked. Environmental impacts (A1-A3) are calculated with embodied carbon factors. The main parameters are explored in a baseline scenario. Then, a second scenario focuses on a hypothetical policy that promotes improvements in building energy performance.
The simulation can be expanded to include more materials and built environment assets and allows for future explorations on, for example, the role of logistics, the implementation of recycling or reuse stations, and, in general, supporting sustainable and circular strategies from the construction sector.

Peer reviewed HUMLAND2: HUMan impact on LANDscapes agent-based model
Fulco Scherjon Anastasia Nikulina Anhelina Zapolska Maria Antonia Serge Marco Davoli Dave van Wees Katharine MacDonald Elena A. Pearce | Published Friday, August 30, 2024The HUMan Impact on LANDscapes (HUMLAND) 2.0.0 is an enhanced version of HUMLAND 1.0.0, developed to track and quantify the intensity of various impacts on landscapes at a continental scale. The model is designed to identify the most influential factors in the transformation of interglacial vegetation, with a particular focus on the burning practices of hunter-gatherers. HUMLAND 2.0.0 incorporates a wide range of spatial datasets as both inputs and targets (expected modelling results) for simulations across Last Interglacial (~130,000–116,000 BP) and Early Holocene (~11,700–8,000 BP).

Peer reviewed FISHCODE - FIsheries Simulation with Human COmplex DEcision-making
Birgit Müller Gunnar Dressler Jonas Letschert Christian Möllmann Vanessa Stelzenmüller | Published Monday, August 05, 2024FIsheries Simulation with Human COmplex DEcision-making (FISHCODE) is an agent-based model to depict and analyze current and future spatio-temporal dynamics of three German fishing fleets in the southern North Sea. Every agent (fishing vessel) makes daily decisions about if, what, and how long to fish. Weather, fuel and fish prices, as well as the actions of their colleagues influence agents’ decisions. To combine behavioral theories and enable agents to make dynamic decision, we implemented the Consumat approach, a framework in which agents’ decisions vary in complexity and social engagement depending on their satisfaction and uncertainty. Every agent has three satisfactions and two uncertainties representing different behavioral aspects, i.e. habitual behavior, profit maximization, competition, conformism, and planning insecurity. Availability of extensive information on fishing trips allowed us to parameterize many model parameters directly from data, while others were calibrated using pattern oriented modelling. Model validation showed that spatial and temporal aggregated ABM outputs were in realistic ranges when compared to observed data. Our ABM hence represents a tool to assess the impact of the ever growing challenges to North Sea fisheries and provides insight into fisher behavior beyond profit maximization.
Shellmound Mobility
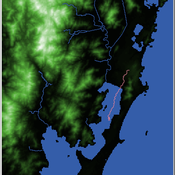
Henrique de Sena Kozlowski | Published Saturday, June 15, 2024Least Cost Path (LCP) analysis is a recurrent theme in spatial archaeology. Based on a cost of movement image, the user can interpret how difficult it is to travel around in a landscape. This kind of analysis frequently uses GIS tools to assess different landscapes. This model incorporates some aspects of the LCP analysis based on GIS with the capabilities of agent-based modeling, such as the possibility to simulate random behavior when moving. In this model the agent will travel around the coastal landscape of Southern Brazil, assessing its path based on the different cost of travel through the patches. The agents represent shellmound builders (sambaquieiros), who will travel mainly through the use of canoes around the lagoons.
How it works?
When the simulation starts the hiker agent moves around the world, a representation of the lagoon landscape of the Santa Catarina state in Southern Brazil. The agent movement is based on the travel cost of each patch. This travel cost is taken from a cost surface raster created in ArcMap to represent the different cost of movement around the landscape. Each tick the agent will have a chance to select the best possible patch to move in its Field of View (FOV) that will take it towards its target destination. If it doesn’t select the best possible patch, it will randomly choose one of the patches to move in its FOV. The simulation stops when the hiker agent reaches the target destination. The elevation raster file and the cost surface map are based on a 1 Arc-second (30m) resolution SRTM image, scaled down 5 times. Each patch represents a square of 150m, with an area of 0,0225km². The dataset uses a UTM Sirgas 2000 22S projection system. There are four different cost functions available to use. They change the cost surface used by the hikers to navigate around the world.
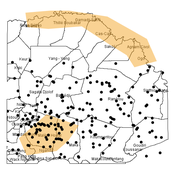
Agent-Based Model for Analyzing the Impact of Movement Factors of Sahelian Transhumant Herds
Cheick Amed Diloma Gabriel TRAORE | Published Tuesday, May 28, 2024Transhumants move their herds based on strategies simultaneously considering several environmental and socio-economic factors. There is no agreement on the influence of each factor in these strategies. In addition, there is a discussion about the social aspect of transhumance and how to manage pastoral space. In this context, agent-based modeling can analyze herd movements according to the strategy based on factors favored by the transhumant. This article presents a reductionist agent-based model that simulates herd movements based on a single factor. Model simulations based on algorithms to formalize the behavioral dynamics of transhumants through their strategies. The model results establish that vegetation, water outlets and the socio-economic network of transhumants have a significant temporal impact on transhumance. Water outlets and the socio-economic network have a significant spatial impact. The significant impact of the socio-economic factor demonstrates the social dimension of Sahelian transhumance. Veterinarians and markets have an insignificant spatio-temporal impact. To manage pastoral space, water outlets should be at least 15 km
from each other. The construction of veterinary centers, markets and the securitization of transhumance should be carried out close to villages and rangelands.
Critical Sustainability Transitions: Relaunching local agriculture after decline (Model code and description)
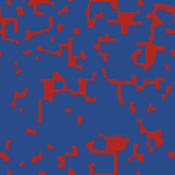
Pedro Lopez-Merino | Published Tuesday, April 30, 2024This model simulates the dynamics of agricultural land use change, specifically the transition between agricultural and non-agricultural land use in a spatial context. It explores the influence of various factors such as agricultural profitability, path dependency, and neighborhood effects on land use decisions.
The model operates on a grid of patches representing land parcels. Each patch can be in one of two states: exploited (green, representing agricultural land) or unexploited (brown, representing non-agricultural land). Agents (patches) transition between these states based on probabilistic rules. The main factors affecting these transitions are agricultural profitability, path dependency, and neighborhood effects.
-Agricultural Profitability: This factor is determined by the prob-agri function, which calculates the probability of a non-agricultural patch converting to agricultural based on income differences between agriculture and other sectors. -Path Dependency: Represented by the path-dependency parameter, it influences the likelihood of patches changing their state based on their current state. It’s a measure of inertia or resistance to change. -Neighborhood Effects: The neighborhood function calculates the number of exploited (agricultural) neighbors of a patch. This influences the decision of a patch to convert to agricultural land, representing the influence of surrounding land use on the decision-making process.
Displaying 10 of 142 results spatial clear search