Our mission is to help computational modelers develop, document, and share their computational models in accordance with community standards and good open science and software engineering practices. Model authors can publish their model source code in the Computational Model Library with narrative documentation as well as metadata that supports open science and emerging norms that facilitate software citation, computational reproducibility / frictionless reuse, and interoperability. Model authors can also request private peer review of their computational models. Models that pass peer review receive a DOI once published.
All users of models published in the library must cite model authors when they use and benefit from their code.
Please check out our model publishing tutorial and feel free to contact us if you have any questions or concerns about publishing your model(s) in the Computational Model Library.
Displaying 10 of 180 results for "Rick L Riolo" clear search

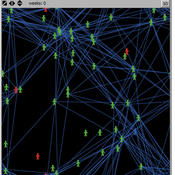
Shellmound Trade
Henrique de Sena Kozlowski | Published Saturday, June 15, 2024This model simulates different trade dynamics in shellmound (sambaqui) builder communities in coastal Southern Brazil. It features two simulation scenarios, one in which every site is the same and another one testing different rates of cooperation. The purpose of the model is to analyze the networks created by the trade dynamics and explore the different ways in which sambaqui communities were articulated in the past.
How it Works?
There are a few rules operating in this model. In either mode of simulation, each tick the agents will produce an amount of resources based on the suitability of the patches inside their occupation-radius, after that the procedures depend on the trade dynamic selected. For BRN? the agents will then repay their owed resources, update their reputation value and then trade again if they need to. For GRN? the agents will just trade with a connected agent if they need to. After that the agents will then consume a random amount of resources that they own and based on that they will grow (split) into a new site or be removed from the simulation. The simulation runs for 1000 ticks. Each patch correspond to a 300x300m square of land in the southern coast of Santa Catarina State in Brazil. Each agent represents a shellmound (sambaqui) builder community. The data for the world were made from a SRTM raster image (1 arc-second) in ArcMap. The sites can be exported into a shapefile (.shp) vector to display in ArcMap. It uses a UTM Sirgas 2000 22S projection system.
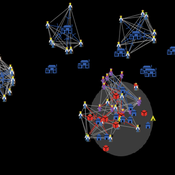
Peer Review with Multiple Reviewers
Flaminio Squazzoni Federico Bianchi | Published Thursday, September 10, 2015This ABM looks at the effect of multiple reviewers and their behavior on the quality and efficiency of peer review. It models a community of scientists who alternatively act as “author” or “reviewer” at each turn.
Eliminating hepatitis C virus as a public health threat among HIV-positive men who have sex with men
Nick Scott Mark Stoove David P Wilson Olivia Keiser Carol El-Hayek Joseph Doyle Margaret Hellard | Published Wednesday, October 12, 2016 | Last modified Sunday, December 16, 2018We compare three model estimates for the time and treatment requirements to eliminate HCV among HIV-positive MSM in Victoria, Australia: a compartmental model; an ABM parametrized by surveillance data; and an ABM with a more heterogeneous population.
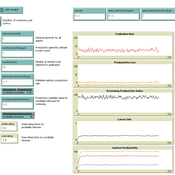
DARTS: an agent-based model of the global food system for studying its resilience to shocks
Hubert Fonteijn | Published Wednesday, November 22, 2023DARTS simulates food systems in which agents produce, consume and trade food. Here, food is a summary item that roughly corresponds to commodity food types (e.g. rice). No other food types are taken into account. Each food system (World) consists of its own distribution of agents, regions and connections between agents. Agents differ in their ability to produce food, earn off-farm income and trade food. The agents aim to satisfy their food requirements (which are fixed and equal across agents) by either their own food production or by food purchases. Each simulation step represents one month, in which agents can produce (if they have productive capacity and it is a harvest month for their region), earn off-farm income, trade food (both buy and sell) and consume food. We evaluate the performance of the food system by averaging the agents’ food satisfaction, which is defined as the ratio of the food consumed by each agent at the end of each month divided by her food requirement. At each step, any of the abovementioned attributes related to the agents’ ability to satisfy their food requirement can (temporarily) be shocked. These shocks include reducing the amount of food they produce, removing their ability to trade locally or internationally and reducing their cash savings. Food satisfaction is quantified (both immediately after the shock and in the year following the shock) to evaluate food security of a particular food system, both at the level of agent types (e.g. the urban poor and the rural poor) and at the systems level. Thus, the effects of shocks on food security can be related to the food system’s structure.
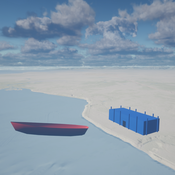
Seascapes of the Unreal: Using Agent Based Modeling to Examine Traditional Coast Salish Maritime Mobility
Adam Rorabaugh | Published Friday, December 22, 2023Non-traditional tools and mediums can provide unique methodological and interpretive opportunities for archaeologists. In this case, the Unreal Engine (UE), which is typically used for games and media, has provided a powerful tool for non-programmers to engage with 3D visualization and programming as never before. UE has a low cost of entry for researchers as it is free to download and has user-friendly “blueprint” tools that are visual and easily extendable. Traditional maritime mobility in the Salish Sea is examined using an agent-based model developed in blueprints. Focusing on the sea canoe travel of the Straits Salish northwestern Washington State and southwest British Columbia. This simulation integrates GIS data to assess travel time between Coast Salish archaeological village locations and archaeologically represented resource gathering areas. Transportation speeds informed by ethnographic data were used to examine travel times for short forays and longer inter-village journeys. The results found that short forays tended to half day to full day trips when accounting for resource gathering activities. Similarly, many locations in the Salish Sea were accessible in long journeys within two to three days, assuming fair travel conditions. While overall transportation costs to reach sites may be low, models such as these highlight the variability in transport risk and cost. The integration of these types of tools, traditionally used for entertainment, can increase the accessibility of modeling approaches to researchers, be expanded to digital storytelling, including aiding in the teaching of traditional ecological knowledge and placenames, and can have wide applications beyond maritime archaeology.
This is v0.01 of a UE5.2.1 agent based model.
SimDrink: An agent-based NetLogo model of young, heavy drinkers for conducting alcohol policy experiments
Nick Scott James Wilson Michael Livingston Aaron Hart David Moore Paul Dietze | Published Friday, September 25, 2015 | Last modified Thursday, October 15, 2015A proof-of-concept agent-based model ‘SimDrink’, which simulates a population of 18-25 year old heavy alcohol drinkers on a night out in Melbourne to provide a means for conducting policy experiments to inform policy decisions.

Logônia: Plant Growth Response Model in NetLogo
Leandro Garcia Daniel Vartanian Aline | Published Saturday, September 13, 2025 | Last modified Tuesday, September 16, 2025Logônia is a NetLogo model that simulates the growth response of a fictional plant, logônia, under different climatic conditions. The model uses climate data from WorldClim 2.1 and demonstrates how to integrate the LogoClim model through the LevelSpace extension.
Logônia follows the FAIR Principles for Research Software (Barker et al., 2022) and is openly available on the CoMSES Network and GitHub.
Collective Decision Making for Ecological Restoration version 2.0
Dean Massey Moira Zellner Cristy Watkins Jeremy Brooks Kristen Ross Lynne M Westphal | Published Wednesday, November 19, 2014CoDMER v. 2.0 was parameterized with ethnographic data from organizations dealing with prescribed fire and seeding native plants, to advance theory on how collective decisions emerge in ecological restoration.
Mast seeding model
Giangiacomo Bravo Lucia Tamburino | Published Saturday, September 08, 2012 | Last modified Saturday, April 27, 2013Purpose of the model is to perform a “virtual experiment” to test the predator satiation hypothesis, advanced in literature to explain the mast seeding phenomenon.
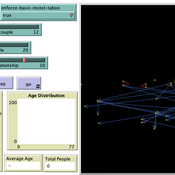
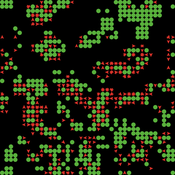
Peer reviewed Monogamous Reproduction in Small Populations and the Enforcement of the Incest Taboo
Ian Stuart | Published Wednesday, January 18, 2023This program was developed to simulate monogamous reproduction in small populations (and the enforcement of the incest taboo).
Every tick is a year. Adults can look for a mate and enter a relationship. Adult females in a Relationship (under the age of 52) have a chance to become pregnant. Everyone becomes not alive at 77 (at which point people are instead displayed as flowers).
User can select a starting-population. The starting population will be adults between the ages of 18 and 42.
…
Displaying 10 of 180 results for "Rick L Riolo" clear search